
Prove Your Migration Worked: A Data Reconciliation Playbook for Databricks
Standard practice in migrations involves reconciliation of data between platforms. There is a surprising gap of functionality built into PySpark and Databricks for this purpose, so I’ve seen various different approaches used in different migrations, with varying levels of effectiveness. The general approach used is to compare combinations of row-count, schema, primary-key, and targeted numeric or string values. Often the output is split over several cells and is not repeatable for multiple sources, leading to developers wasting a tonne of time.
We realised at some point that it really shouldn’t be too hard to create an automated workflow for this purpose. What we ended up with is a neat tool which provides a pretty comprehensive comparison of any two PySpark dataframes - this can be used in a loop across many tables, for many different purposes, all via a single class.
This post will build up from the most theoretical/simple comparison use cases we’d want, and then bring it all together and show off our column comparison tool with some examples.
Row Count
Start with row count. It is a fast validation signal, but it does not prove that two dataframes contain the same data. For instance, the dataframes below have matching row counts:
Dataframe A
| id | name |
|---|---|
| 1 | george |
| 2 | cloony |
Dataframe B
| id | name |
|---|---|
| 10000 | leonardo |
| 294082190 | capricorn |
The row count of Dataframe A is 2, the same as Dataframe B. But they are clearly not the same.
Different row counts require investigation; they do not automatically mean data is missing. For instance, Dataframe C below has 3 rows but Dataframe D has 2 because a null-only row has been intentionally dropped.
Dataframe C
| id | name |
|---|---|
| 1 | john |
| 2 | doe |
| 3 | null |
Dataframe D
| id | name |
|---|---|
| 1 | john |
| 2 | doe |
Here Dataframe C has 3 rows and Dataframe D has 2, so the row counts do not match. Dataframe D still fully accounts for Dataframe C's meaningful data because row 3 is null. Row count tells us where to investigate; it cannot explain the difference on its own.
Schema Comparison
Next, compare column names and data types. This confirms whether the dataframe structure has changed, but it does not tell us whether the rows match.
Dataframe Q
| id | name | |
|---|---|---|
| 1 | alice | alice@example.com |
| 2 | bob | bob@example.com |
Dataframe R
| id | name | |
|---|---|---|
| 3 | charlie | charlie@example.com |
| 4 | diana | diana@example.com |
Dataframe Q and Dataframe R share an identical schema - the same three columns (id, name, email), yet contain completely different rows. Schema comparison alone would tell us the columns are aligned, but it would not flag that every single row is different.
Primary Key Comparison
One of the most useful ways of comparing dataframes is to join them on the primary key. From here you can compare whether all the same keys exist in both dataframes. This can be done with some simple SQL:
The most useful version is where there are missing or extra rows in either dataframe, as shown below:
SELECT
  COALESCE(k.id, l.id) AS id,
  CASE
    WHEN k.id IS NULL THEN 'only_in_l'
    WHEN l.id IS NULL THEN 'only_in_k'
  END AS mismatch_type
FROM dataframe_k AS k
FULL OUTER JOIN dataframe_l AS l
  ON k.id = l.id
WHERE k.id IS NULL
   OR l.id IS NULL
Dataframe K
| id | name |
|---|---|
| 1 | alice |
| 2 | bob |
| 3 | charlie |
Dataframe L
| id | name |
|---|---|
| 1 | alice |
| 2 | bob |
| 4 | diana |
Dataframe M (Output)
| id | mismatch_type |
|---|---|
| 3 | only_in_l |
| 4 | only_in_k |
This query catches missing and extra primary keys, but it does not compare the remaining values in rows that join successfully. If both dataframes have the same IDs but the rest of each row differs, it will not show that problem, as below:
Dataframe N
| id | name |
|---|---|
| 1 | alice |
| 2 | bob |
Dataframe O
| id | name |
|---|---|
| 1 | null |
| 2 | null |
Dataframe P (Output)
| id | mismatch_type |
|---|---|
| no rows returned | |
Both dataframe ID columns are identical, but Dataframe O has no values in its name column. Column value comparisons can be easy or complex depending on the type and how many columns you need to compare.
Comparison of Values
Primary-key comparison tells us whether the expected records are present. To confirm that those records were migrated correctly, compare values after joining on the primary key. Comparing every value in every row gives the strongest check, but it can be expensive at scale. In practice, join on the primary key and compare the columns that matter most to the migration.
Our Column Comparison Tool
Krystal clarity’s column comparison tool automates, consolidates and outputs the above comparisons in a clean way.
Let’s go through an example, here are two arbitrary dataframes:
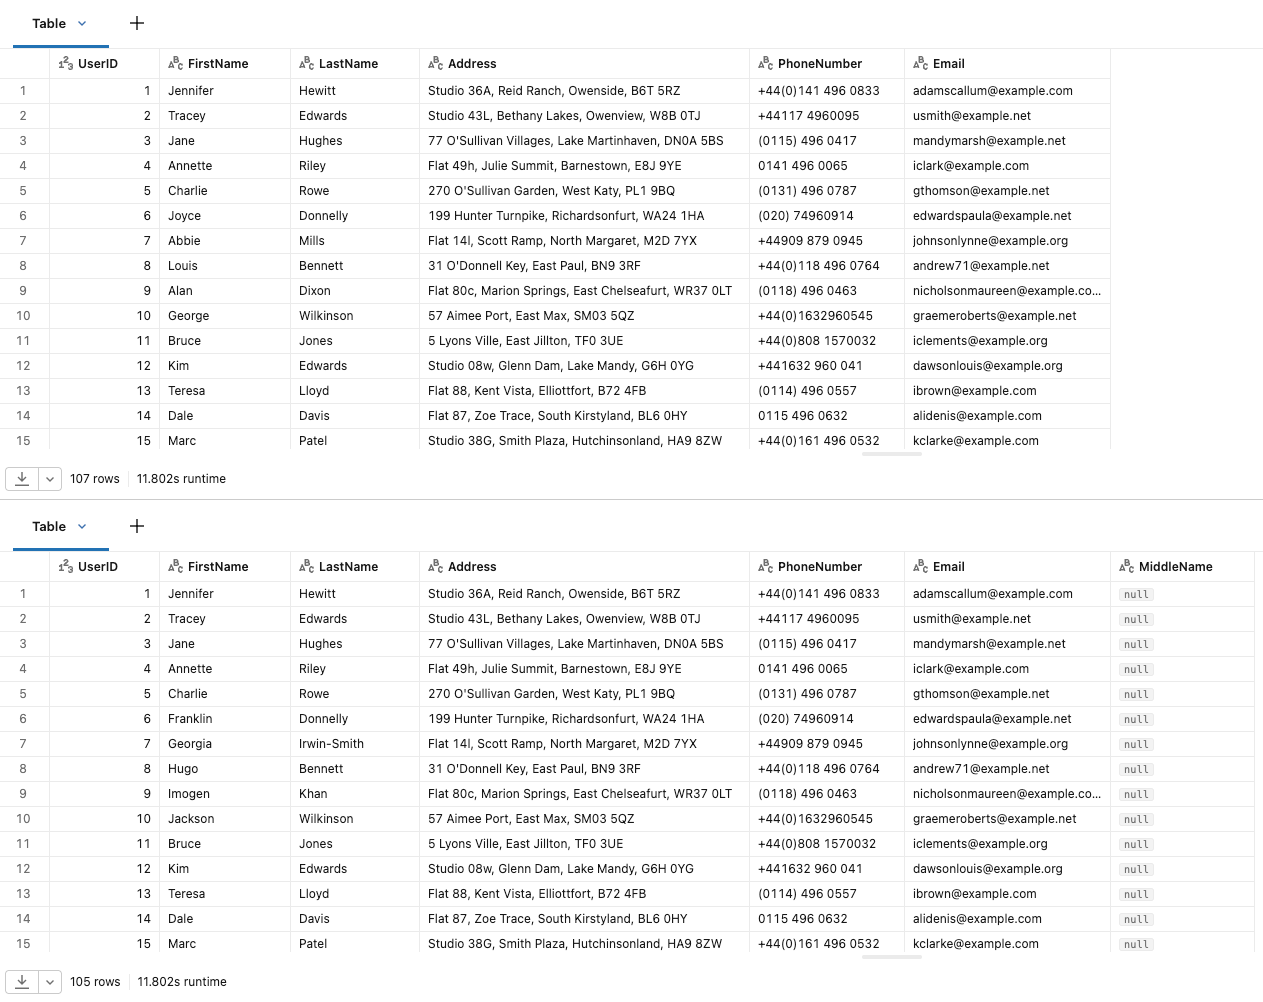
For this example, I generated the dataframes with the Faker Python library and then added different rows and columns so the results are easy to inspect. The following Python code can be run in a notebook:
from column_comparison import ColumnComparison

comparison = ColumnComparison(
    input_dataframes=[
        spark.table("old_customer_table"),
        spark.table("new_customer_table"),
    ],
    join_key_columns=["UserID"],
    columns_to_compare=["FirstName", "LastName"],
)
comparison.display_pretty()
The tool takes the two dataframes, the primary key shared by both, and the columns to check after joining on that key. It produces three report views.
Schema Comparison
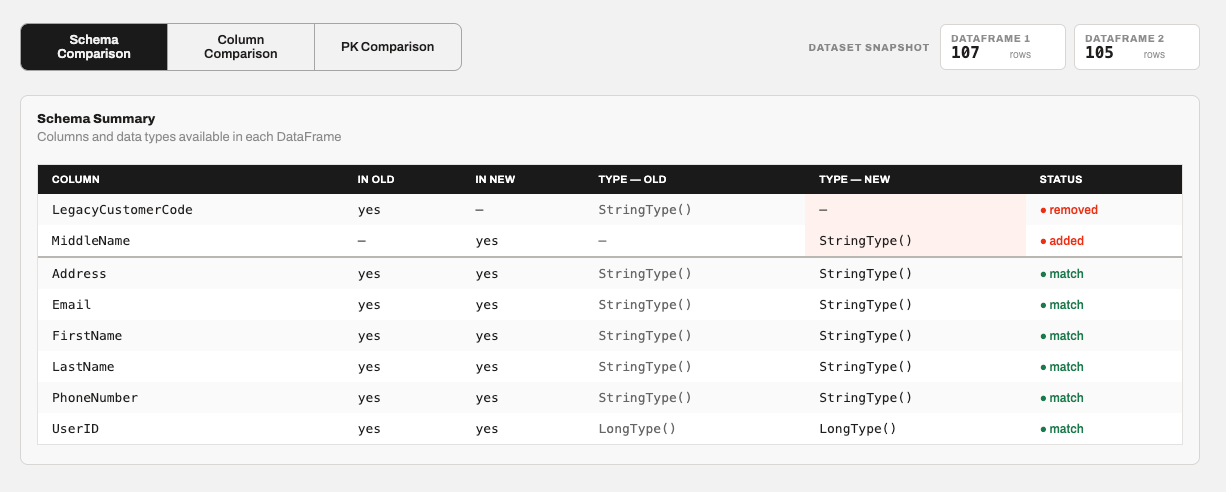
This is fairly straightforward. We can see by looking at the first 2 rows, that each dataframe has one exclusive column: LegacyCustomerCode has been removed from Dataframe 2, and MiddleName has been added. The remaining columns and data types match.
Column Comparison
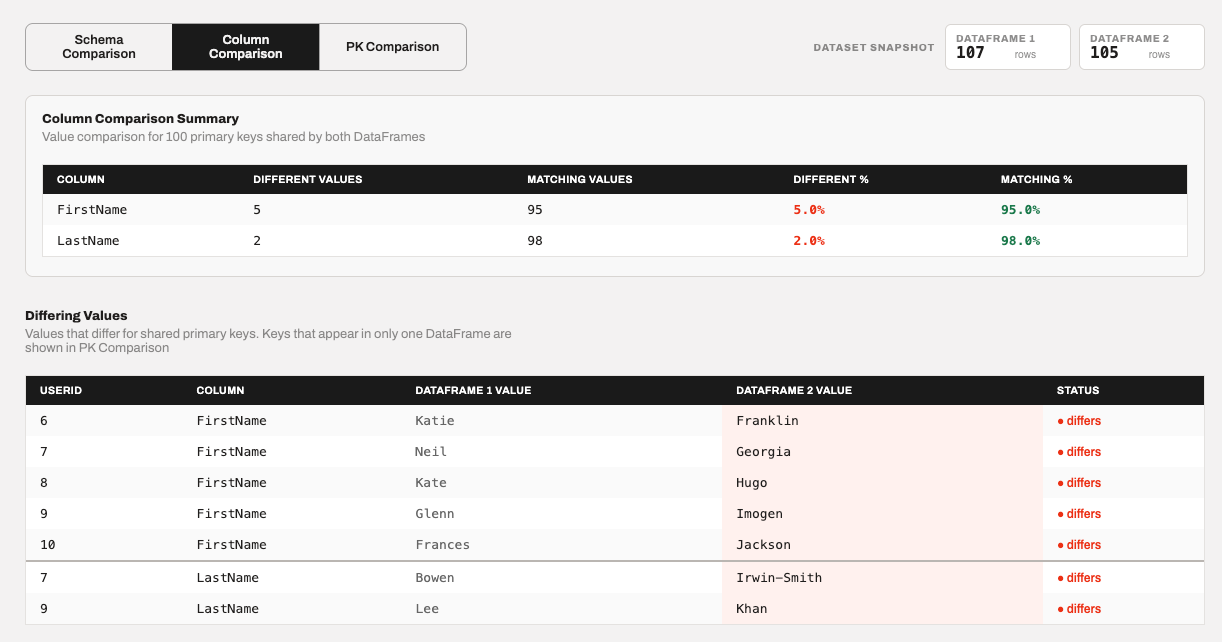
The summary at the top shows how many values match and differ across the 100 shared primary keys. For FirstName, 95 values match and 5 differ; the same calculation is shown for LastName.
The lower section shows the exact differences. For example, the first row shows that FirstName was Katie in Dataframe 1 and is Franklin in Dataframe 2.
Primary Key Comparison
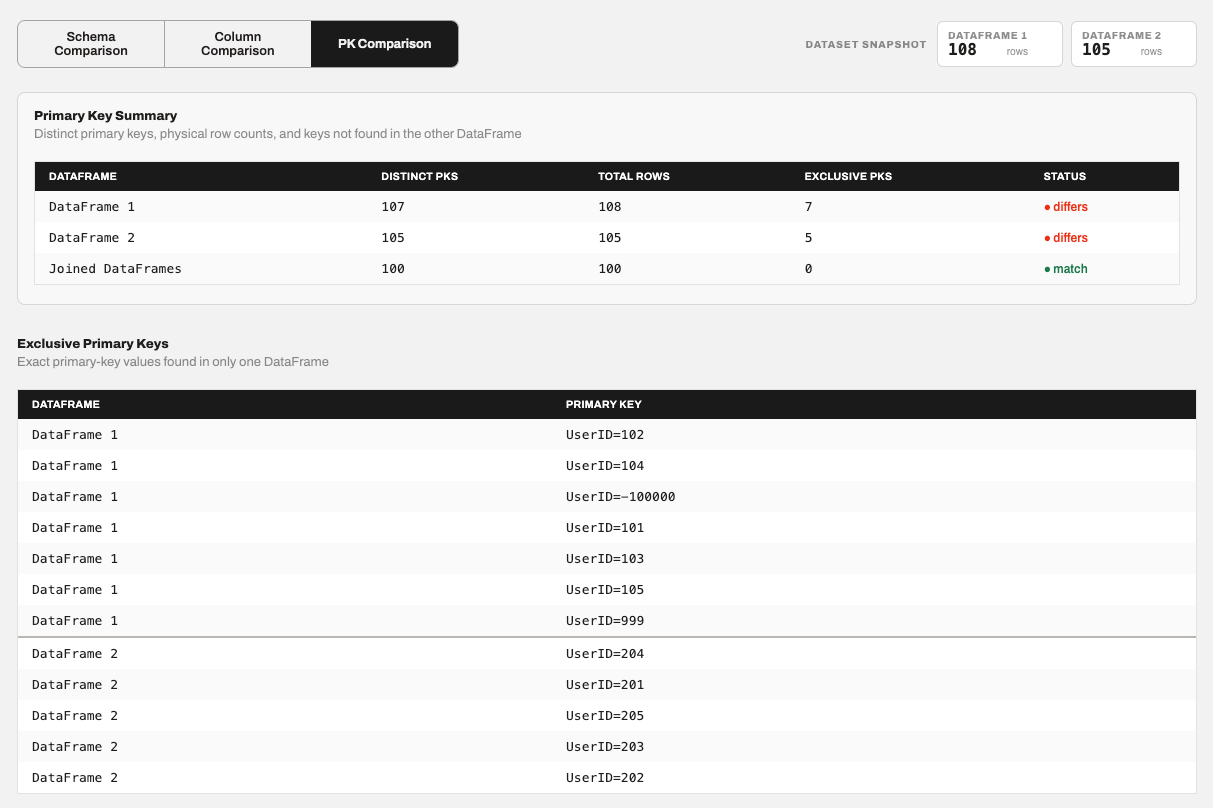
The Primary Key Summary shows the number of distinct primary keys, the total row count, and the keys exclusive to each dataframe. Dataframe 1 has 107 distinct primary keys but 108 rows, meaning one primary key is duplicated. Its 7 exclusive primary keys are not present in Dataframe 2.
The Exclusive Primary Keys section then lists those exact keys for further analysis. We can use them to query the specific differing rows and compare them between the two DataFrames.
Further analysis
The dataframes created and used by this Python object are saved as attributes, so we can use them in the rest of the notebook as normal Spark dataframes:
display(comparison.input_dataframes[0])
display(comparison.input_dataframes[1])
display(comparison.schema_comparison_df)
display(comparison.difference_analysis_df)
display(comparison.key_analysis_stats_df)
display(comparison.primary_key_comparison_df)
display(comparison.primary_key_exceptions_df)
The first two are the input dataframes. The remaining dataframes are the same results shown in the report:
schema_comparison_df shows the columns and data types found in each dataframe.
difference_analysis_df shows the exact differing values for primary keys shared by both dataframes.
key_analysis_stats_df contains the matching and differing value counts for each selected column.
primary_key_comparison_df contains the distinct primary-key count, total row count, and exclusive primary-key count.
primary_key_exceptions_df contains the exact primary keys found in only one dataframe.
This means we can start with the report to understand the migration, then use the individual DataFrames to investigate a specific difference, build further checks, or aggregate results from many tables in a loop, which can be fed into further dashboards or reports.
Conclusion
Our ColumnComparison tool helps optimise and streamline the often overlooked process of data reconciliation in data migrations. We’ve shared the repo if you want to pull it and give it a go - let us know how you get on if you do!
Happy reconciling!